
Many parents just glance at the total screen time, feel a bit worried, and then close the app. That number — whether it’s five hours, three hours, or seven hours — doesn’t really tell you much. What truly matters is what’s inside that number.
A child’s app usage report gives you more meaningful insights. It breaks down screen time into specific details, showing which apps your child uses, how long they spend on each, what categories make up most of their day, and whether your limits are actually making a difference. For example, four hours on social media feels very different from four hours split among games, educational apps, and creative activities — but the total screen time might look the same!
This guide will help you understand how to read your child’s app usage report, explain what each section means, and suggest how to use that information.
Why the Total Number Misleads Parents
Half of all teens aged 12 to 17 report four or more hours of daily screen time. That statistic is alarming in isolation. However, context changes everything.
The American Academy of Pediatrics threw out its two-hour daily limit in January 2026, replacing it with a framework focused on quality and context rather than strict hour counts. A child watching two hours of high-quality interactive educational content is in a very different situation from a child watching two hours of algorithmically optimized autoplay.
That shift matters for how you read usage data. The goal isn’t to get the number as low as possible. It’s to understand what’s inside the number — and whether the balance reflects the habits you want your child to build.
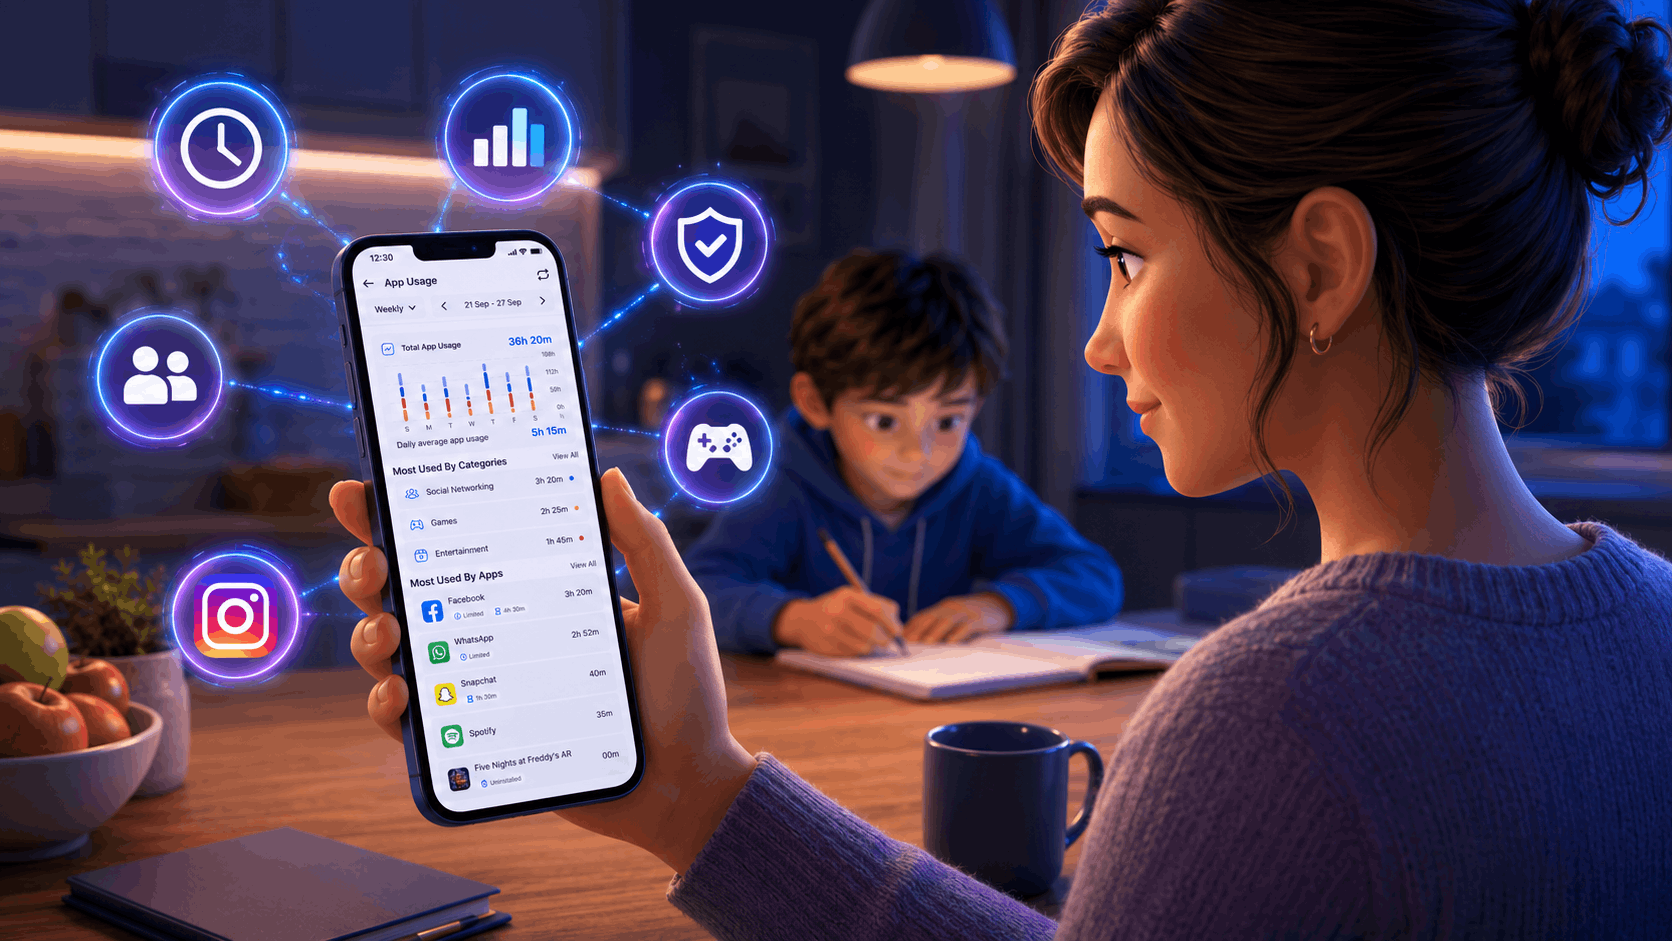
What Kupola’s App Usage Report Shows You
Kupola’s App Usage feature gives parents four views of the same data, each useful for a different purpose.
Daily View
The daily view shows total usage for a single day, broken down by hour across a 24-hour chart. Below the chart, you can see the most-used categories and the specific apps your child opened that day, with the exact time spent on each app.
This view is most useful for spotting specific incidents. A late-night spike at 11pm. A two-hour session on a Wednesday afternoon when your child was supposed to be doing homework. The daily view gives you the most granular picture.
Weekly View
The weekly view shows total usage for a seven-day period, with a daily bar chart showing how each day compares. The daily average sits prominently at the top — this is the number worth tracking over time, not the daily total.
This view is most useful for identifying weekly patterns. Does usage spike every Friday evening? Does Sunday tend to be heavier than other days? Patterns are more actionable than single-day numbers.
Monthly View
The monthly view breaks the month into four weeks and shows how total usage compares week by week. The weekly average is the headline number here.
This view is most useful for tracking progress when you’ve made a change — introduced a new schedule, set a new limit, had a family conversation about phone habits. Come back four weeks later and compare.
Apps View and Categories View
These two lists are often the most revealing part of the report.
The Apps view shows every app your child used, ranked by time, with the exact minutes or hours next to each one. Crucially, it also shows the status of each app — whether a daily time limit has been set, whether the app is blocked, or whether it was uninstalled. That status layer tells you whether your rules are in place and being respected.
The Categories view groups all app usage into categories: Social Networking, Games, Entertainment, Productivity, Creativity, Education, and Others. This is where the shape of your child’s digital day becomes clear at a glance.
How to Read the Categories View
This is the section most parents skip. It’s the most important one.
A typical child’s categories breakdown might look like this:
- Social Networking — 3h 20m
- Games — 2h 25m
- Entertainment — 1h 45m
- Productivity — 1h 20m
- Creativity — 50m
- Education — 50m
That breakdown tells a specific story. Social Networking alone accounts for more time than Productivity, Creativity, and Education combined. Games take up more time than either of the constructive categories on their own. Entertainment adds nearly two more hours on top.
The question to ask isn’t “Is this too much?” It’s “Does this reflect the balance I want my child to have?” If Education sits at the bottom of that list every single week, that’s useful information. If Social Networking has been growing month over month, that’s a trend worth addressing before it becomes a habit.
What the Status Badges Mean
In the Apps view, each app shows a status badge alongside the time data. These badges tell you whether your family’s rules are active and working.
Limited means you have set a daily time cap for that app. The badge shows both the limit you set and the actual time used. If Facebook shows “Limited — 4h 30m” but the time used is 3h 20m, the limit is working. If the time used consistently hits the cap exactly, your child is using every minute available, which may prompt you to revisit whether the limit is right.
Blocked means the app is fully inaccessible on your child’s device. If a blocked app shows any usage time, that warrants a conversation.
Uninstalled means the app was removed from the device. It still appears in the list so you have a complete record, but usage shows as zero. This is useful for confirming that apps you removed are actually gone.
Three Patterns Worth Acting On
Heavy social media use before limits are set
If Social Networking dominates the categories view and no limits are in place, that’s the first thing to address. Teens exceeding three hours per day of social media face double the risk of depression and anxiety, according to the US Surgeon General’s Advisory. Setting a daily limit on social apps takes about two minutes in Kupola and kicks in automatically from that point forward. You can do this directly from the app usage screen by tapping any app and setting a daily cap.
Late-night usage in the daily chart
The hourly chart in the daily view shows exactly when your child’s phone is most active. A bar appearing at 11pm or midnight is a clear signal that your current schedule isn’t covering the right hours. Kupola’s screen time schedules let you set a bedtime lock that activates automatically every night — no negotiation needed, because the phone simply becomes unavailable. Screen time in the hour before bed is associated with 23% shorter sleep duration and 49% worse sleep quality in children.
Unknown apps with significant usage time
If an app appears in the list that you don’t recognize — with meaningful usage time — look it up before assuming it’s harmless. Several of the most concerning platforms for children look unremarkable in a usage list. A useful companion to the usage report is Kupola’s installed app list, which shows every app on your child’s device and lets you block anything directly from the same screen. Our post on apps parents should know about covers the specific platforms worth checking for.
How to Use the Report With Your Child — Not Just About Them
The most effective use of a usage report isn’t a confrontation. It’s a conversation.
Show your child the category breakdown. Ask them how they feel about it. Most children, when they see their own data, react in ways more self-aware than parents expect. A teenager who sees that social networking takes up more time than everything else combined often has something to say about it — especially if you ask rather than tell.
The framing that works: “Here’s what last week looked like. Does this feel like the right balance to you?” That question opens a conversation about values, not just rules. Praising positive habits you notice keeps the focus on healthy tech use, not just restrictions. If Education time went up compared to last week, say so.
What a Healthy Usage Pattern Looks Like
There’s no universal answer, but a reasonable starting benchmark for a school-age child on a weekday:
- Social Networking under 1 hour
- Games under 1 hour
- Education and Productivity combined are higher than either social or games
- No usage between 9pm and 7am
This benchmark adjusts for weekends, school holidays, and age, serving as a gentle guide rather than a strict rule. The goal isn’t to enforce a precise split but to have a mindful standard you’ve chosen intentionally, rather than one that just happens by default.
Make it a habit to check the report weekly during the first month after setting it up. After that, a monthly review usually suffices, unless you notice a behavioral change that makes you want to check sooner.
Download Kupola — easily set up app usage reports and get a clear, comprehensive view of your child’s digital world. It only takes about ten minutes to get everything ready.